Zipf's law and sharding
Nicolae Vartolomei · 2022/06
You are an online business with some millions of customers.
customer_count = 1_000 # Enough to illustrate the point and have a quick simulation.Customers are sending events to your business. You process and store these events.
import collections

class Server:
    def __init__(self):
        self.events_by_customer = collections.defaultdict(int)
    def process_event(self, customer: int, event: dict = None):
        # In practice, more like `self.events_by_customer[customer].append(event)`.
        self.events_by_customer[customer] += 1
After a while, you discover that a single server can’t handle all customers anymore. You add more servers, and using a method you found in a clever book, you route customers to different servers.
import cityhash

class Cluster:
    def __init__(self, servers: list[Server]):
        self.servers = servers
    def process_event(self, customer: int, event: dict = None):
        self._choose_server(customer).process_event(customer, event)
    def _choose_server(self, customer):
        # Consistent hashing is in a different chapter.
        return self.servers[cityhash.CityHash64(customer) % len(self.servers)]
To make sure that you’ve done everything right, you run a simulation:
import numpy as np

server_count = 9
event_count = 100_000_000

cluster = Cluster([Server() for _ in range(server_count)])

for customer in np.random.randint(0, customer_count, event_count):
    cluster.process_event(str(customer))
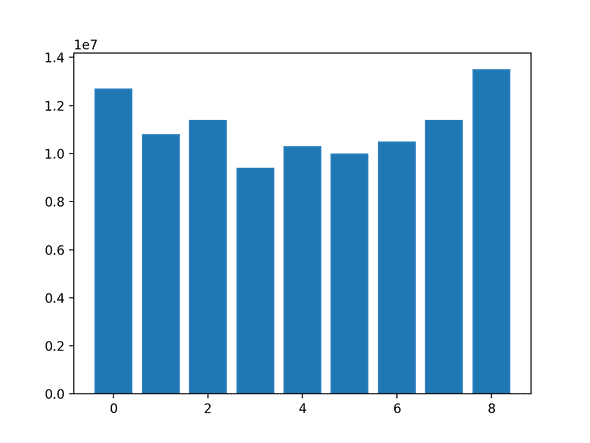
And check the results:
import matplotlib.pyplot as plt

plt.bar(
    range(0, len(cluster.servers)),
    [sum(server.events_by_customer.values()) for server in cluster.servers],
)
plt.show()
You pat yourself on the back and deploy to production. And, you discover Zipf’s law1 🥴.
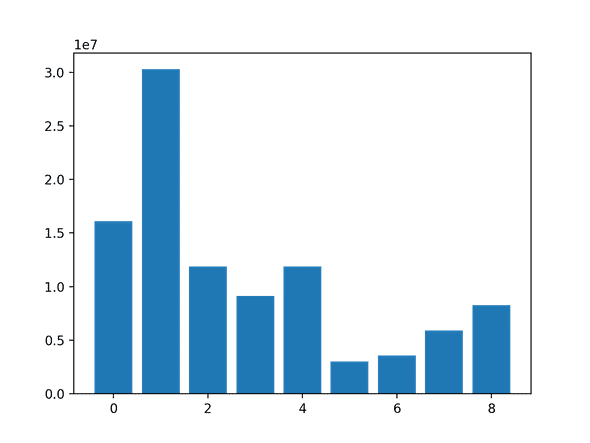
Customers are large and small, Mostly small, but few are very, very large. You check individual server utilization, and you see a completely different picture.
You love simulations. So, you quickly run a new one which illustrates the reality much better:
cluster = Cluster([Server() for _ in range(server_count)])

event_draws = 0
while event_draws < event_count:
    maybe_customer = np.random.zipf(1.2) - 1
    if maybe_customer < customer_count:
        cluster.process_event(str(maybe_customer))
        event_draws += 1

plt.clf()
plt.bar(
    range(0, len(cluster.servers)),
    [sum(server.events_by_customer.values()) for server in cluster.servers],
)
plt.show()
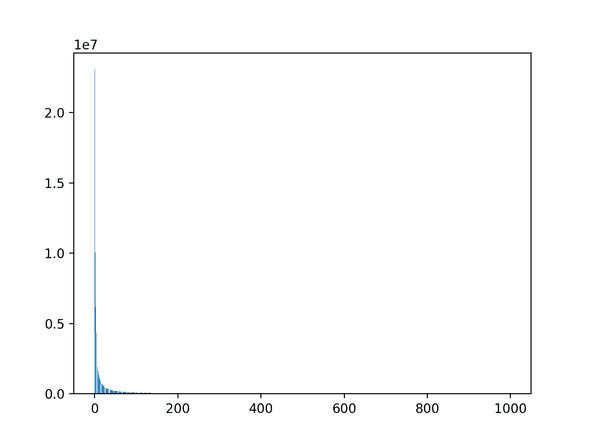
You cry a bit 😭, and you check event distribution by customer:
plt.clf()
plt.bar(
    range(0, customer_count),
    [
        sum(
            [
                collections.Counter(server.events_by_customer)
                for server in cluster.servers
            ],
            collections.Counter(),
        )[str(customer)]
        for customer in range(0, customer_count)
    ],
)
plt.show()
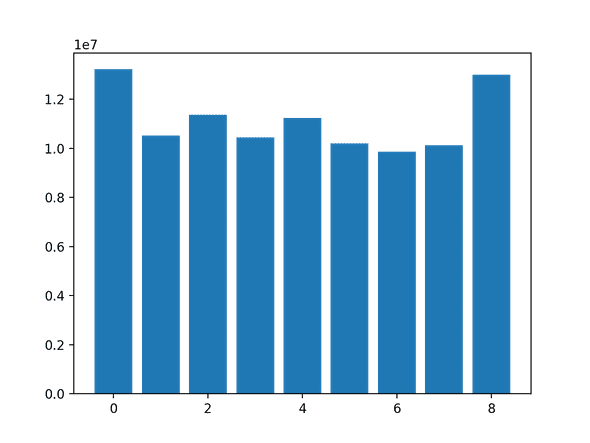
And, if you are lucky, you’ll have a lightbulb moment 💡: distributing a few large customers (ones on the left side of the chart) to more servers will result in a uniform distribution of events across all servers.
import math

class Cluster:
    def __init__(self, servers: list[Server]):
        self.servers = servers
        # It is enough to track only |servers| * log(|servers|) keys. 18 keys in this example!
        self.very_large_customers = [str(ix) for ix in range(len(servers) * int(math.log(len(servers))))]
    def process_event(self, customer: int, event: dict = None):
        self._choose_server(customer).process_event(customer, event)
    def _choose_server(self, customer):
        if customer in self.very_large_customers:
            return self.servers[np.random.randint(len(self.servers))]
        return self.servers[cityhash.CityHash64(customer) % len(self.servers)]

cluster = Cluster([Server() for _ in range(server_count)])

event_draws = 0
while event_draws < event_count:
    maybe_customer = np.random.zipf(1.2) - 1
    if maybe_customer < customer_count:
        cluster.process_event(str(maybe_customer))
        event_draws += 1

plt.clf()
plt.bar(
    range(0, len(cluster.servers)),
    [sum(server.events_by_customer.values()) for server in cluster.servers],
)
plt.show()
This is looking much better. You take a break ☕️, and digest what you’ve learned today.
Conclusion
I’ll write one later. For now, you can continue with reading the Pegasus2 paper to see this used in practice.
- Zipf’s law and the Internet. Lada A. Adamic, 2002.↩
- Pegasus: Tolerating Skewed Workloads in Distributed Storage with In-Network Coherence Directories. Jialin Li, 2020.↩


